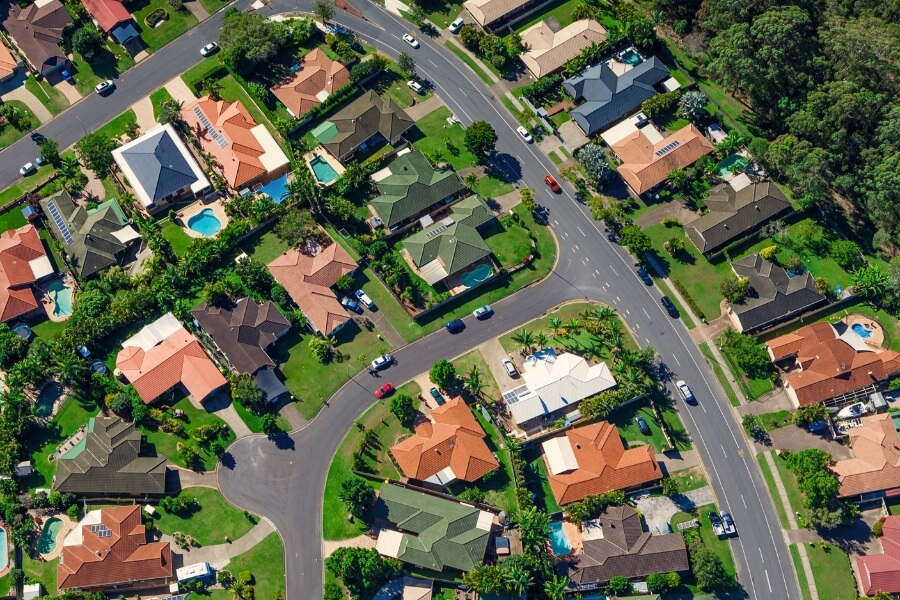
20 years of real estate data: 6 things you need to know.

The REIA Market Facts 20-Year Report takes a deep-dive into the last 20 years of Australian real estate.
The report covers sale prices, rental prices, lending and investing trends across the country from June 2002 to June this year.
So, from two decades of data, what matters to you and what doesn’t?
Here’s what you need to know:
- Australia’s market growth from 2002-2022
- The cost-to-income ratio: a question of affordability
- After 20 years of slow growth, the rental market ramps up
- Interest rates and the fixed-rate mortgage cliff
- Is 2023 finally the year of the unit?
- The COVID tree-change
1. Australia’s market growth from 2002-2022 and the city that surprised us all
Here are the big numbers from the last 20 years across Australia:
Median selling price growth:
- Houses – 104%
- Other dwellings – 51%
Median weekly rent price growth:
- Houses – 41%
- Other dwellings – 39%
Note: other dwellings encompass units, townhouses, flats and terraced housing.
What do the numbers mean?
On average, if you bought a house in 2002 and held it until June this year, its value would have approximately doubled. Whereas, if you bought a unit or townhouse in 2002, you would have gained half of the original price in capital growth.
Homely’s Head of Industry, David Webb, says this comparison really speaks to the Australian preference for a home and land.
“While the adage of location, location, location has held true over the last 20 years, it has been apparent that those who compromised on their ideal suburb in order to afford a freestanding home have fared better than those opting for apartments in the inner cities.”
What surprised us?
Hobart came out on top of the growth in capital cities with a 269% median sale price increase on houses.
Webb comments, “20 years ago, nobody predicted Hobart would be able to nearly quadruple its market value. In the past two decades, the city has built a strong cultural and food scene which, combined with its relative affordability, seem to have made it very attractive to interstate and international buyers.
2. The cost-to-income ratio: a question of affordability
Key information:
- Australia’s median house sale price grew 56% in the last 10 years
- Australia’s median household income increased by 10.2% in the same time
- In June 2002, a home cost the equivalent of 6 years of the average family income
- By June 2022, this equivalent had climbed to 8 years and 9 months – adding nearly three years.
What does this mean?
As a first-time buyer, breaking into the market has become harder in the last 20 years. The report shows that it’s not just our accelerated market growth, but a complex equation of the following:
- Sale prices have grown rapidly – houses have doubled in price since 2002
- The average household income has grown minimally. Our wages aren’t keeping up with the price of houses and it’s taking longer to save.
The report also pictures a growing gap between the target cash rate and the average interest rate charged by lenders. This tells us that borrowing money is becoming more expensive.
Webb comments, “Now, we have to spend more than ever before to buy a house. People are borrowing less for the same cost with interest rates rising progressively higher than the cash rate.”
An economist’s point of view
Economist and Co-Founder of BuyersBuyers, Pete Wargent says, “After twenty years of price increases, the deposit hurdle has increased very significantly for first homebuyers.”
He notes that state governments have an opportunity to give first-home buyers a leg up over that initial deposit hurdle through changes like the NSW stamp duty reform, set to take effect in January 2023.
Pete explains, “This historic reform allows first home buyers to opt for an annual property tax instead of paying stamp duty.”
He continues, “NSW now has an advantage over other states. Until now, someone buying a property for $1.5 million in Sydney has had to pay $67,000 in stamp duty – a serious disincentive not only to buying but also to subsequently selling and upgrading.”
As a result of this, Pete predicts, “We expect the lower price quartile of the Sydney market to begin its recovery in the first quarter of 2023, as more buyers take advantage of the reforms from 16 January onwards.”
3. After 20 years of slow growth, the rental market ramps up
Key information:
- Median weekly rent price remained largely unchanged between 2010 and 2020
- Weekly average rent prices started growing again from 2020, representing the first real growth trend since 2006
- Vacancy rates plunged below the ‘healthy’ benchmark of 3% at the end of 2020, dropping to a 2% average by June 2022
What does this mean?
After approximately ten years of stalled median weekly rent prices, sharp price increases throughout 2022 have been a shock to tenants.
What is driving the prices up and why now? Australia’s rental market is influenced by three key factors:
- Owner-occupier-to-investor property ownership ratio
- When property investors have a higher share of the market stock, there are more houses up for rent. From about 2020, newe, more strict tenancy laws saw an exodus of investors from the market as many rentals became too costly to maintain
- Vacancy rates
- This tells us how many long-term rental properties are vacant for rent and is an indicator of competition in the market for renters. When the vacancy rate drops, competition picks up, allowing weekly rental prices to rise in line with demand.
- Population growth via immigration
- A large portion of new arrivals to Australia are renters, not home buyers. As immigration picks up post-COVID, the competition in the rental market grows with demand outweighing supply.
An economist’s point of view
Pete says, “Demand for housing in Australia has been strong over the past 20 years, and this will accelerate over the next 20 years.”
He explains, “This is expected to create a good deal of pressure on the rental markets in 2023. Prices have generally increased faster than rents over the past 20 years, leading to declining and record low rental yields.”
Signs show this theme could be set to turn, and soon.
4. Interest rates and the fixed-rate mortgage cliff
Key information:
- 2020 and 2021 saw the 20yr period’s steepest increase in lending to owner-occupiers
- The investor share of all housing loans has been trending down from 46% in 2015 to 35% in 2022
- Both owner-occupier and investor lending decreased in line with the 2022 interest rate hikes
- Fixed home loan interest rates dropped to an all-time low, averaging 2% between 2020-2021
What does this mean?
The increase in lending to owner-occupiers coincided with the all-time low interest rate on fixed-rate loans. This meant that home buyers were incentivised by low lock-in interest rates at a time when discretionary spending was also at an all-time low thanks to the pandemic. Buying became a more affordable option at that moment in time.
Webb explains the variation in investor numbers caused by these market conditions, “During this period, it was cheap to borrow, so many investors grew their portfolios while still others purchased their first investment.”
He continues, “Since then, interest rates have climbed and the legislation has changed, seeing the return on these investments dwindle. This has led to many of these speculators leaving the market.”
An economist’s point of view
Pete explains that we’re about to reach the edge of a ‘fixed-rate mortgage cliff’.
He says, “As interest rates dropped to a record low through the pandemic, fixed-rate mortgage volumes were extraordinarily high for six consecutive quarters from the September 2020 quarter through to the quarter that ended December 2021.”
He continues, “In Australia, the most common fixed-rate tenure is 2 years, which means that from now, a material volume of fixed-rate mortgages secured at extremely low interest rates is beginning to reset to much higher rates.”
Pete adds, “The increase in mortgage rates delivered to date will negatively impact household consumption over the next 18 months.”
“There are plenty of moving parts, but it’s not hard to see that such a huge switch is going to create some major tremors for existing borrowers, which will in turn have significant implications for household consumption going forward.”
5. Is 2023 finally the year of the unit?
Key information:
- Following a steep increase in 2016, 2017-onwards saw a decline in the completion of new units, apartments and townhouses – still trending down as of June 2022.
- Overall, the average median price for units, apartments and townhouses increased 51% over the past 20 years, but decreased 5.4% in the last 5 years.
What does this mean?
While units, apartments and townhouses have been in over-supply and therefore under-valued for the last 5 years, we may soon meet a new level of demand in the market for these types of properties. That demand could in turn drive sale prices back up – meaning apartment and unit owners could be set to see real capital growth for the first time in years.
Webb explains, “As ‘Other Dwellings’ were in over-supply in this period they started to offer lower returns for developers. This saw the volume of new builds in the last few years start to stall.”
He continues, “Now, with fewer of these options available for buyers looking for value in a competitive market, these kinds of homes could see a climb in sale price.”
6. The COVID tree-change
Dwelling transfers in regional Australia climbed steeply between 2020 and 2022. This confirms the narrative of pandemic tree changes, where inner-city homeowners fled the constraints of lockdowns and reconsidered their priorities when it came to thinking about where they should live. Those living in metro areas of Melbourne and Sydney in particular chose to move regional for more space and proximity to other family members.
Interestingly, we’ve seen a portion of these tree-changers return to metro areas as life has settled to a ‘post-covid normal’. The question is – will this regional move trend hold up or die down? With the rise of remote working in our post-pandemic world it’s possible we’ll see it continue, albeit with less intensity than between 2020 and 2022.

Share this article

Similar articles


Find the
latest properties
to hit the market

We'd like to hear from you!
1 comment
Great ideas, Your information is very inspiring. Keep it going. Thanks
land and house package canberra